Accessing read quality
Here, we would like to focus a little more on the topic of assessing read quality. We will see why this is so important when we look at the next dataset, which we will load directly from NCBI SRA to Galaxy.
Check new Illumina and Nanopore data
It is also possible to upload data directly to NCBI without first storing it on your own PCR. To do this, we will look at two new data sets: SRR25338386 und SRR27030578.
Du kannst diese Informationen nutzen, um herauszufinden um was es sich für Daten handelt: NCBI SRA.
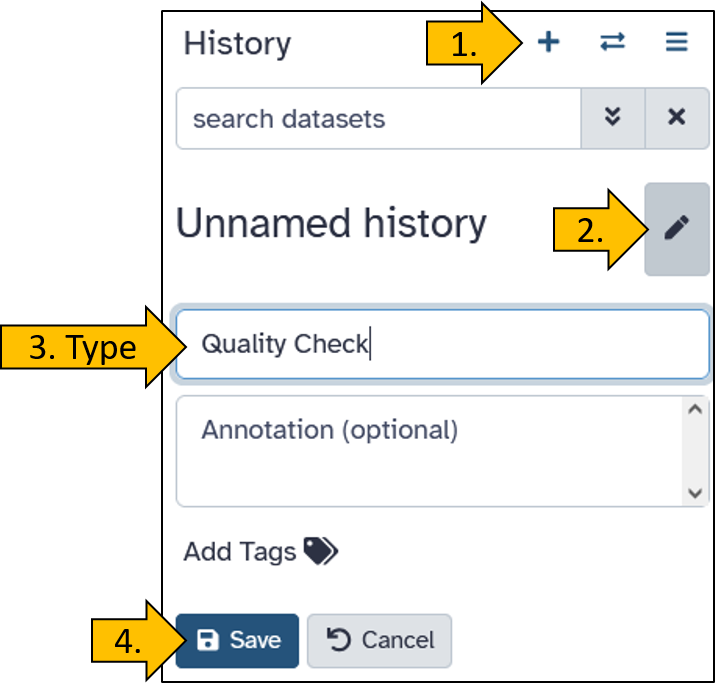
Create a new history
Create a new empty history and rename it to Quality Check.
Upload NCBI SRA data directly to Galaxy.
Here we learn how to get the data directly from SRA to a new history.
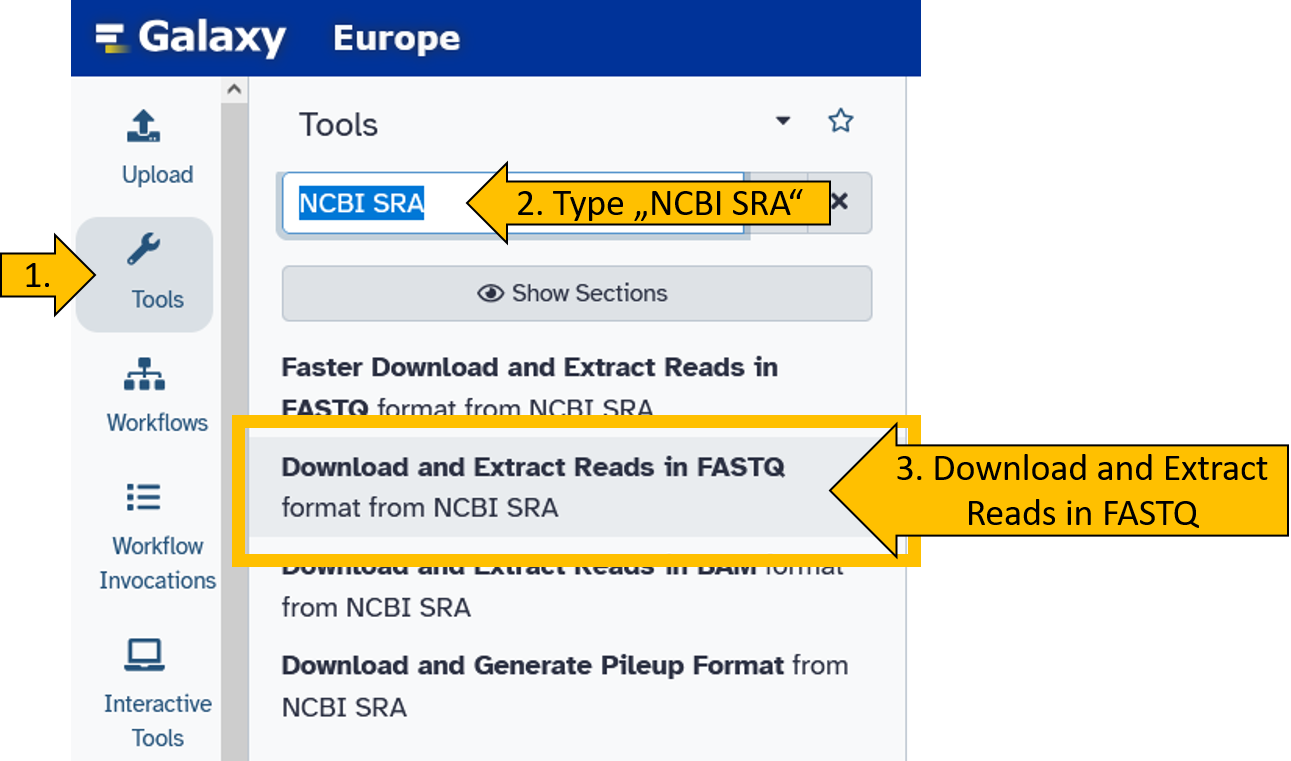
First, we select the Download and Extract Reads in FASTQ.
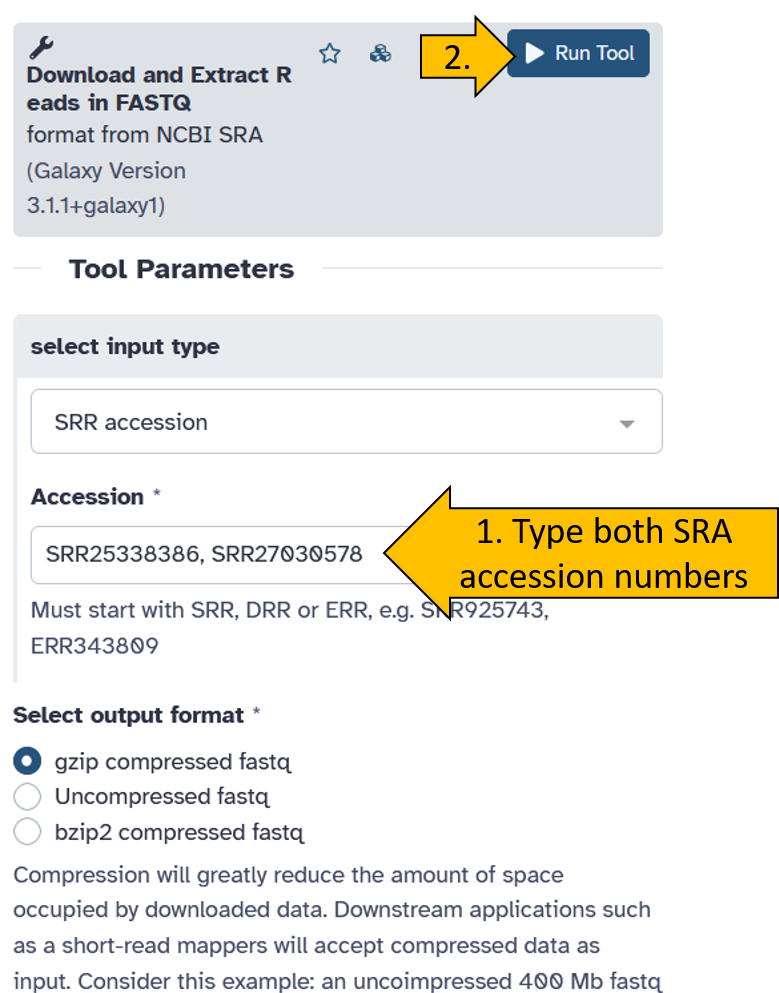
Now enter both SRA Accession numbers (SRR25338386 und SRR27030578) and start the tool. We leave all other parameters at their default settings.
An active job should then appear in your history, displayed in grey/orange. This means that the data is being downloaded from NCBI SRA.
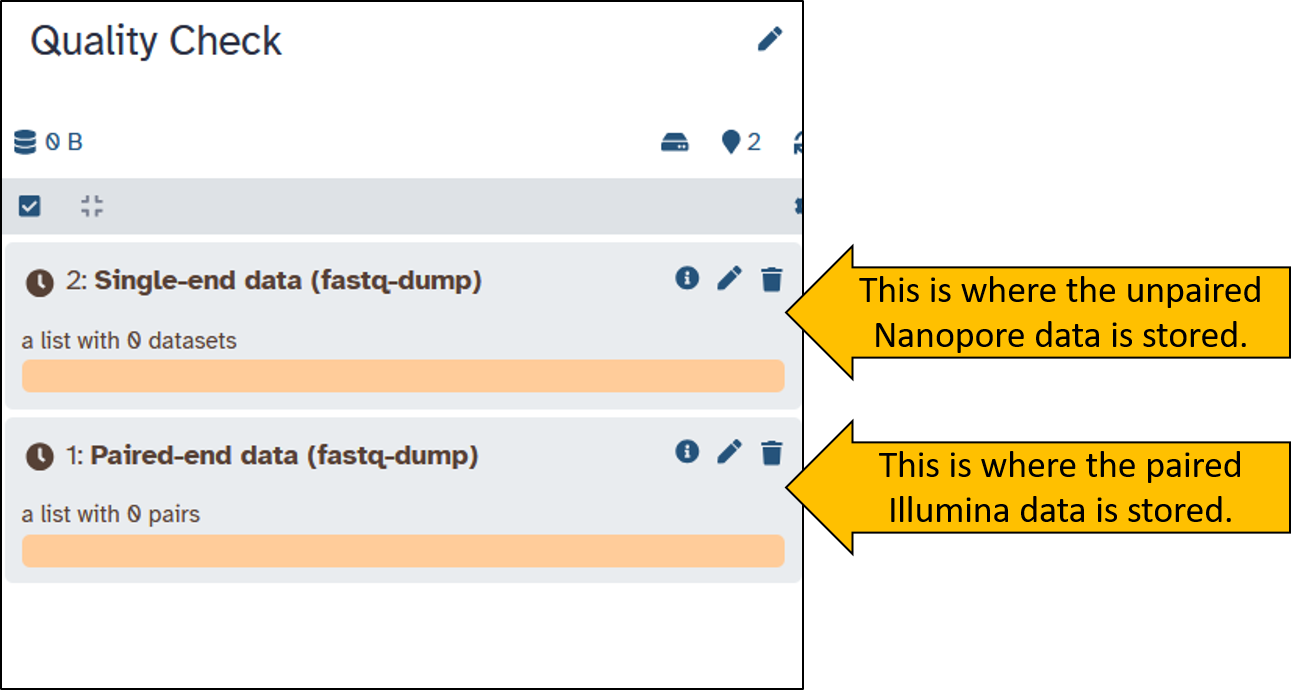
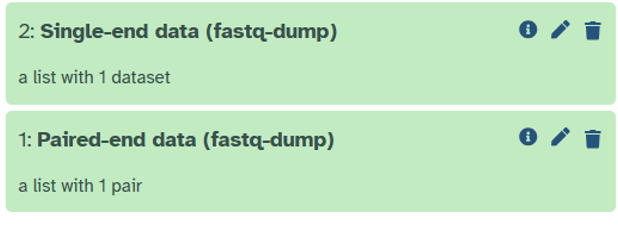
When the download is complete, both items should be green in the history. We have received two Collection containing the sequence data. Collections are useful for preventing the history from becoming overloaded with files. Collections can contain multiple files. Play around with the Collections a little and try to understand what they are all about.
Quality check - Nanopore reads
Before we start working with data, we always check its quality. You should always be sure about the data you are working with.
Run the tool nanoplot on the Nanopore data.
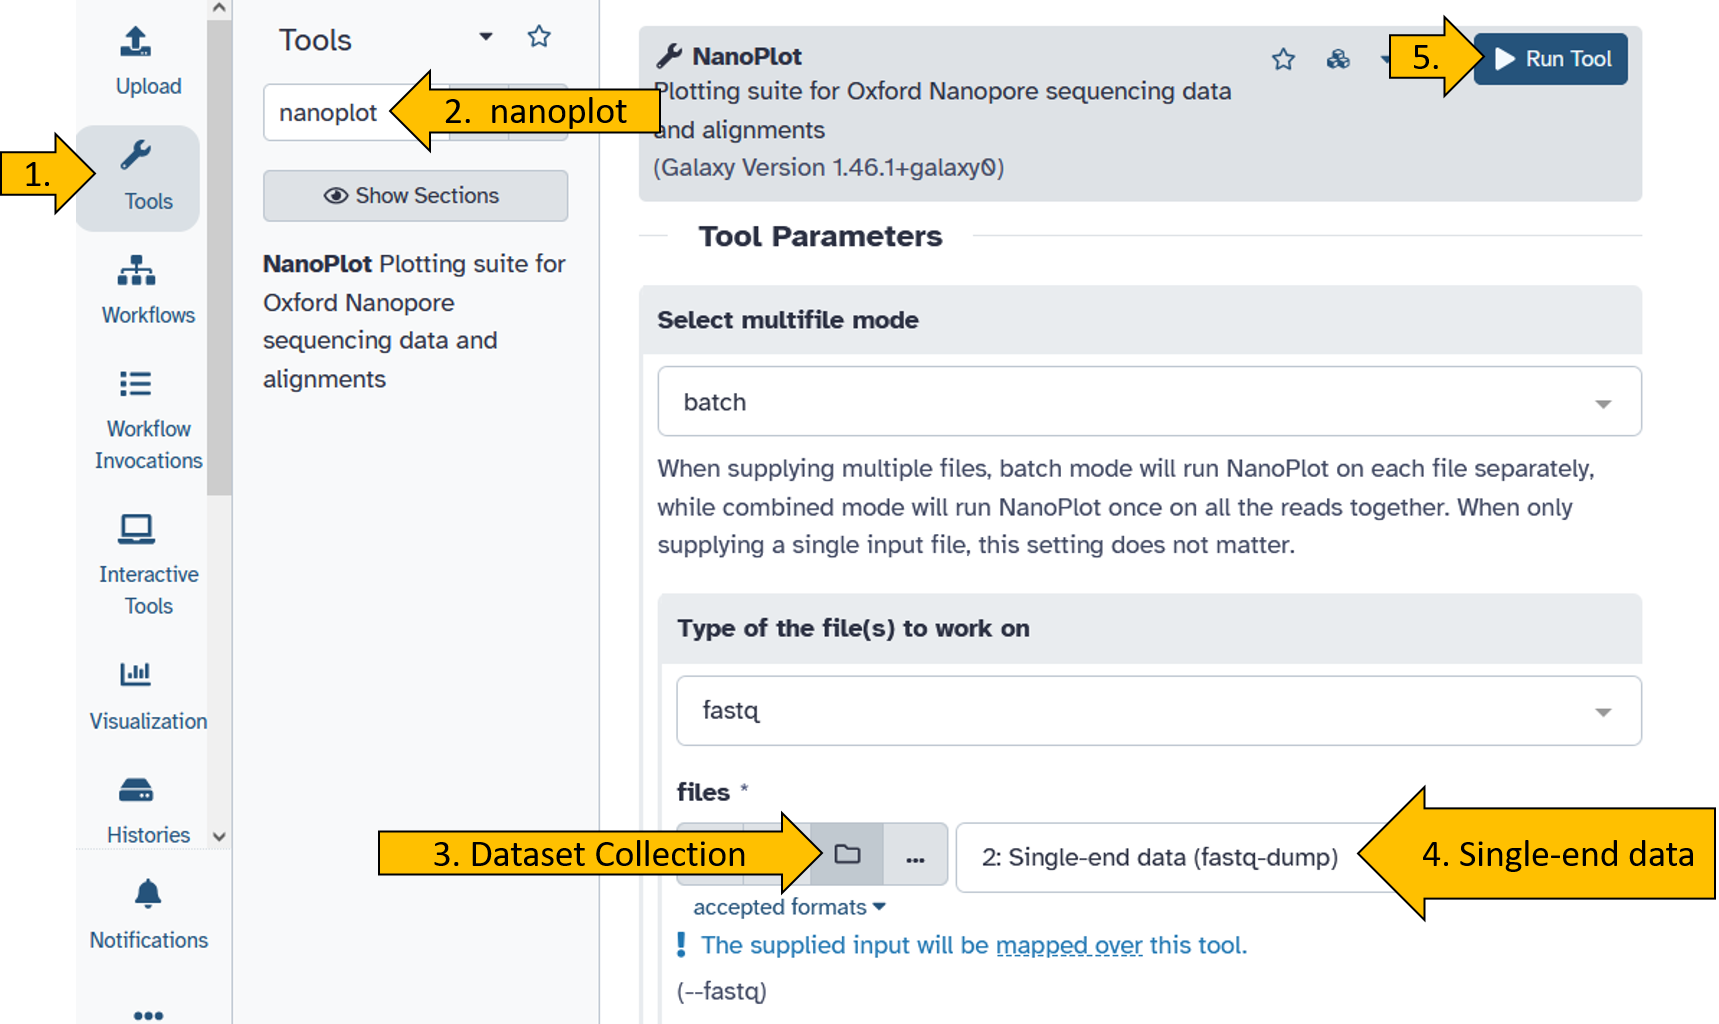
When the nanoplot tool has finished running (turned green), do the following:
- Click on the NanoStat file:

- Click on the eye to see the result:
You should get this view of the results for the nanopore reads:
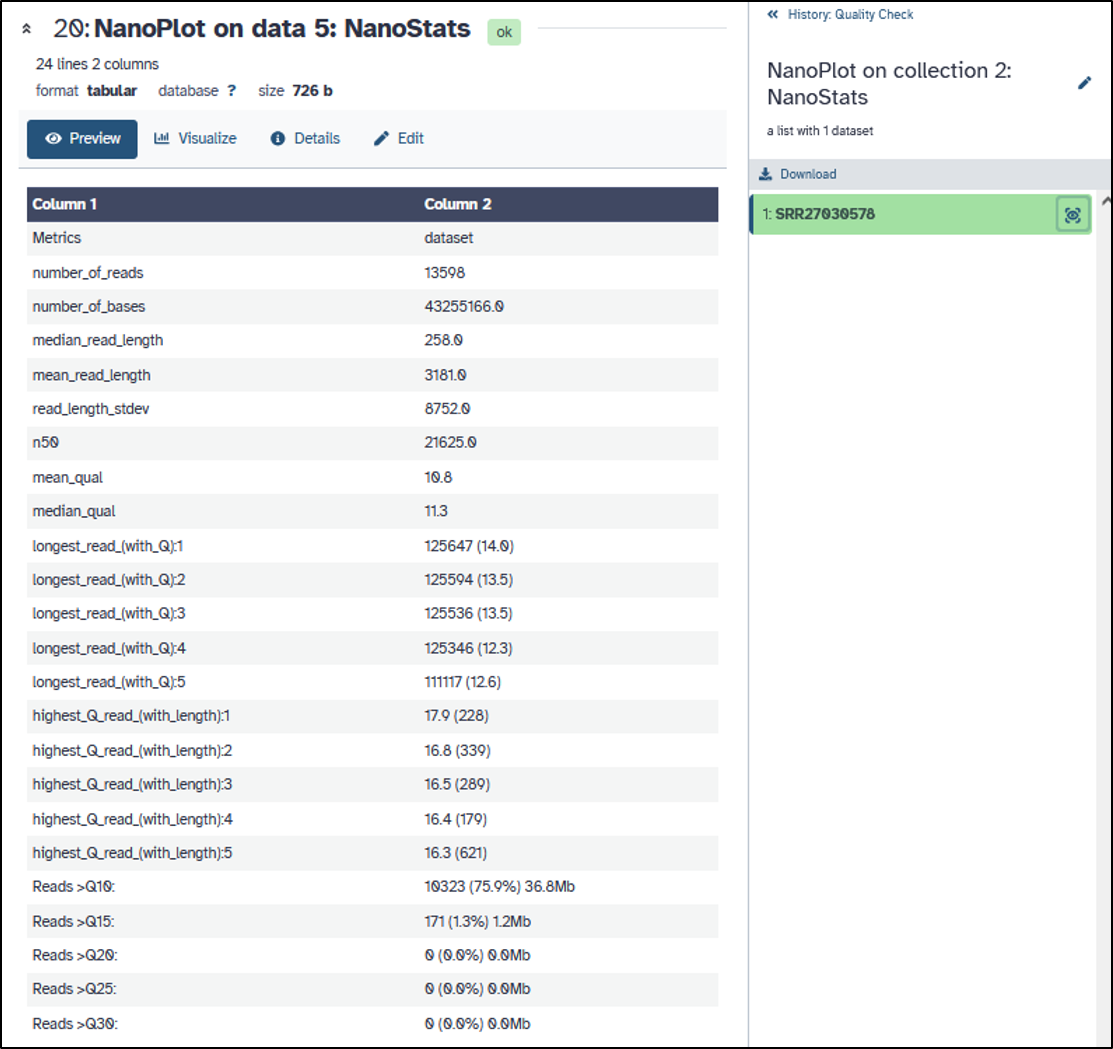
- How long are the Nanopore reads?
- What is the avarge read quality (Q)?
- Can you determine the average error probability (P)?
Quality check Illumina reads
Since Illumina reads are the most widely used, it is most likely that you will be working with this data. Therefore, we will take a closer look at the quality of Illumina data.
Run the tool falco on the Nanopore data.
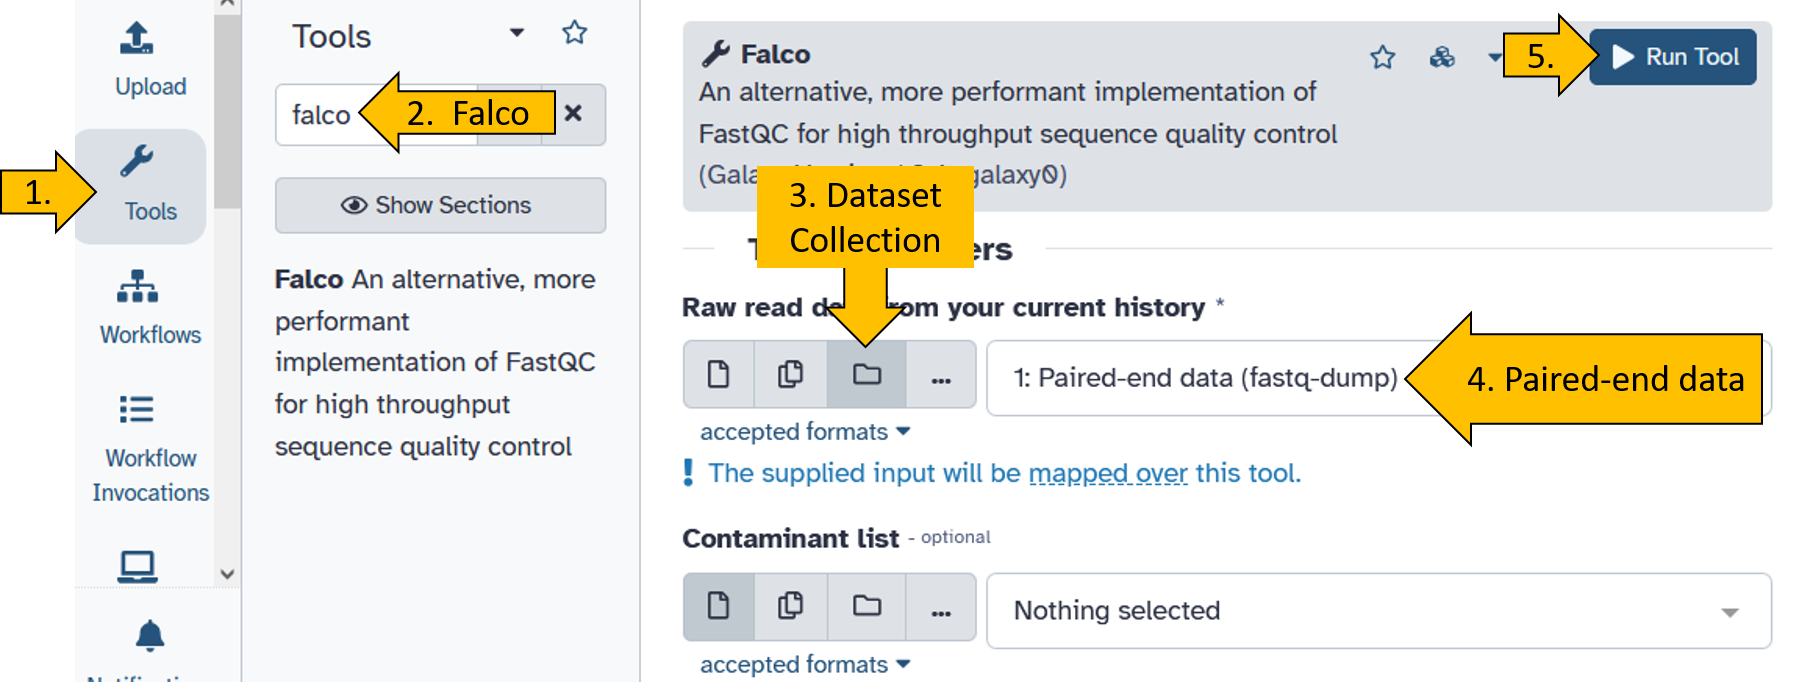
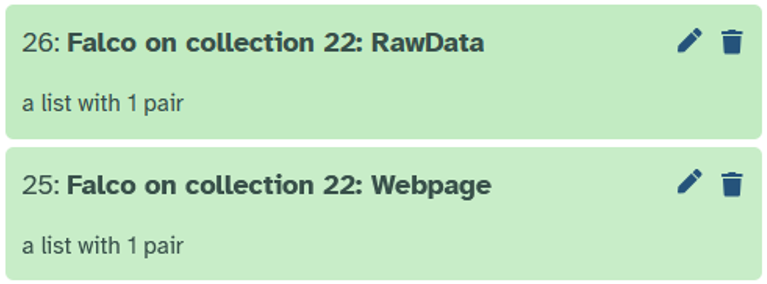
When the falco tool has finished running (turned green), do the following:
Click on the
Falco on X: Websitefile: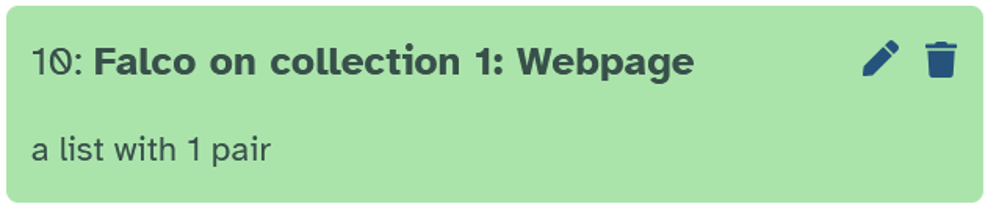
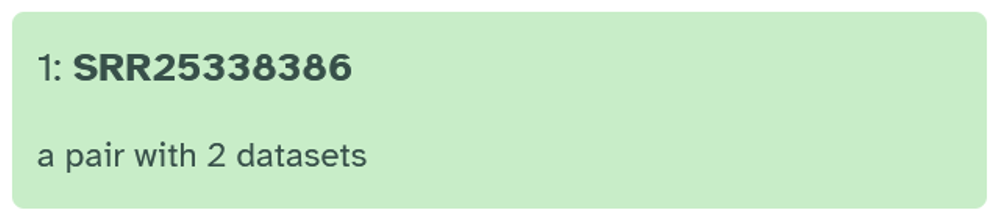
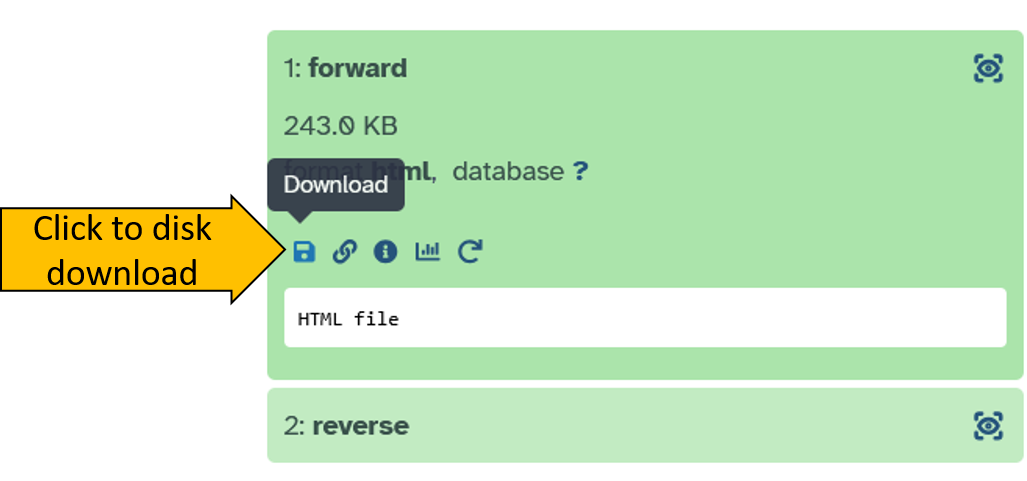
Click on the collection:
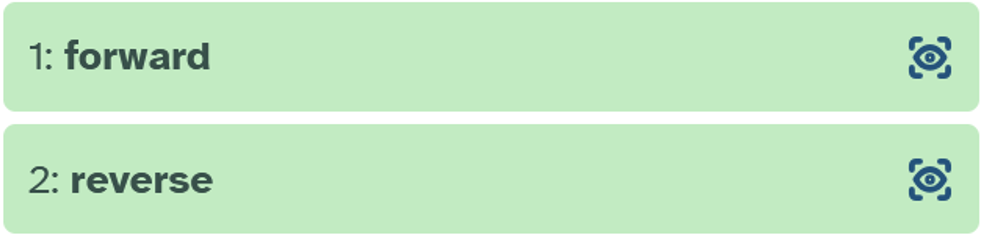
Click on the forward file:
Save the file on your computer:
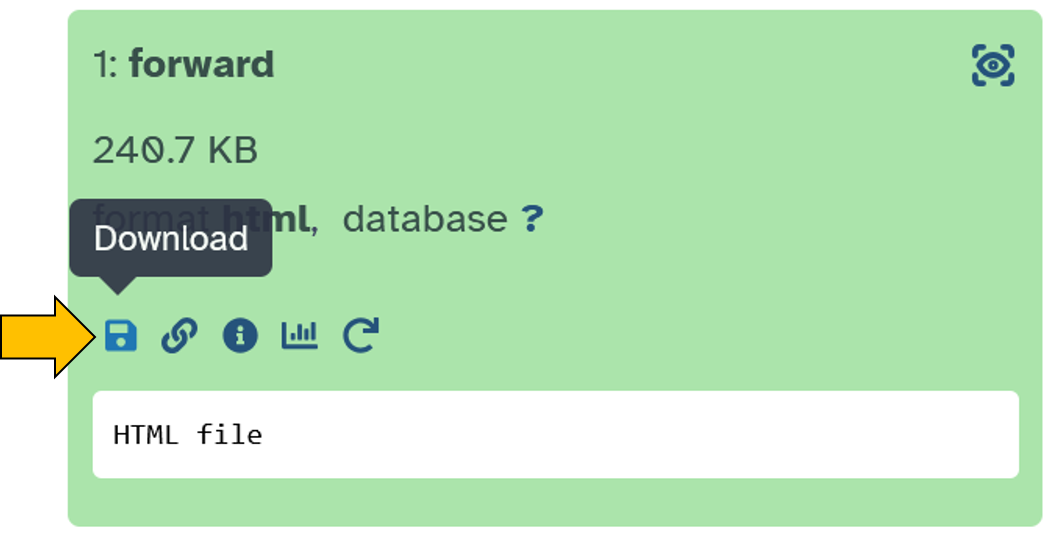
Unzipthe downloaded file.Open the
htmlfile.
The output should look like the example below. Can you answer the following questions?
- How long are the Illumina reads?
- What is the avarge read quality (Q)?
- Can you say something about the error probability (P)?
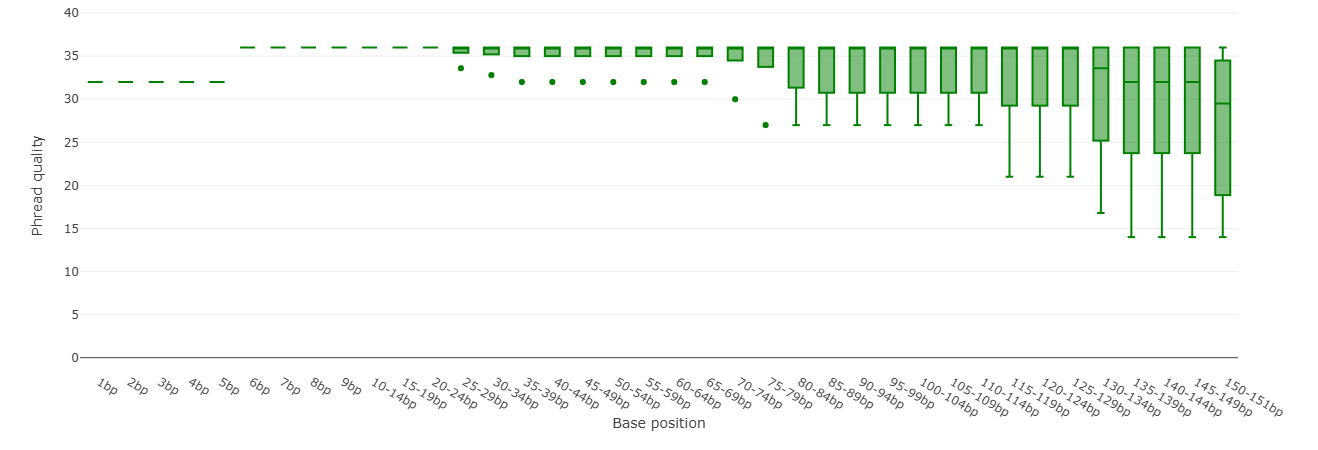
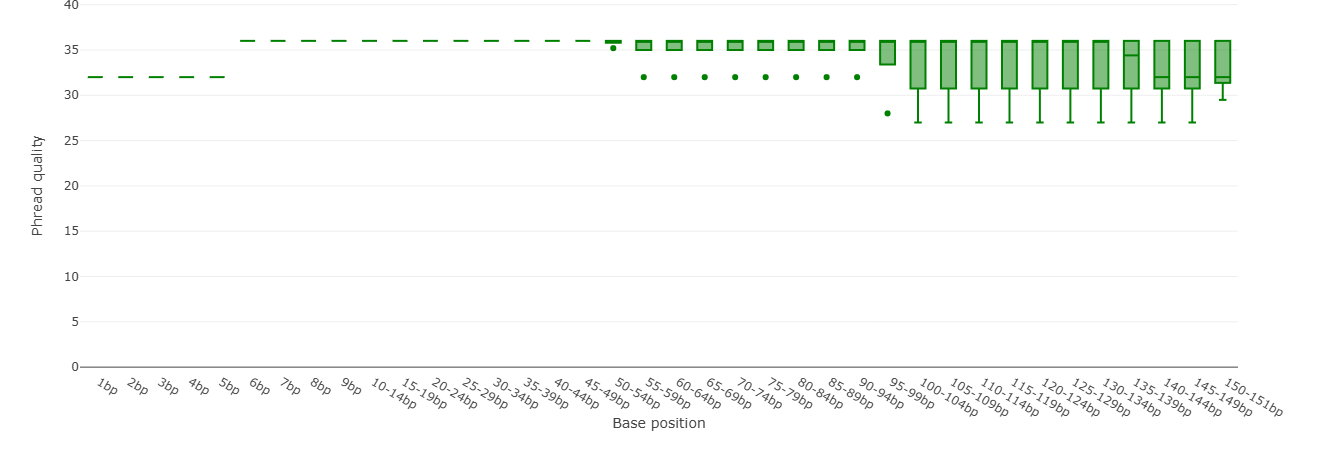
Per Base Sequence Quality (Falco)
We pay particular attention to the quality of the sequencing, as this tells us what level of accuracy or error probability we can expect. This can be decisive for the next steps.
The falco tool provides us with a quality plot (base sequence quality plot) that shows us how well individual bases were determined during sequencing.
- X-axis: Position of the base on the read.
- Y-axis: Quality value (Q; Phred score). High value = higher quality = base was determined more accurately.
The plot can be interpreted as follows: At the beginning of the reads (left), the sequencing is more accurate. Further along at the end of the reads (right), the quality tends to decrease. In other words, accuracy decreases with increasing length.
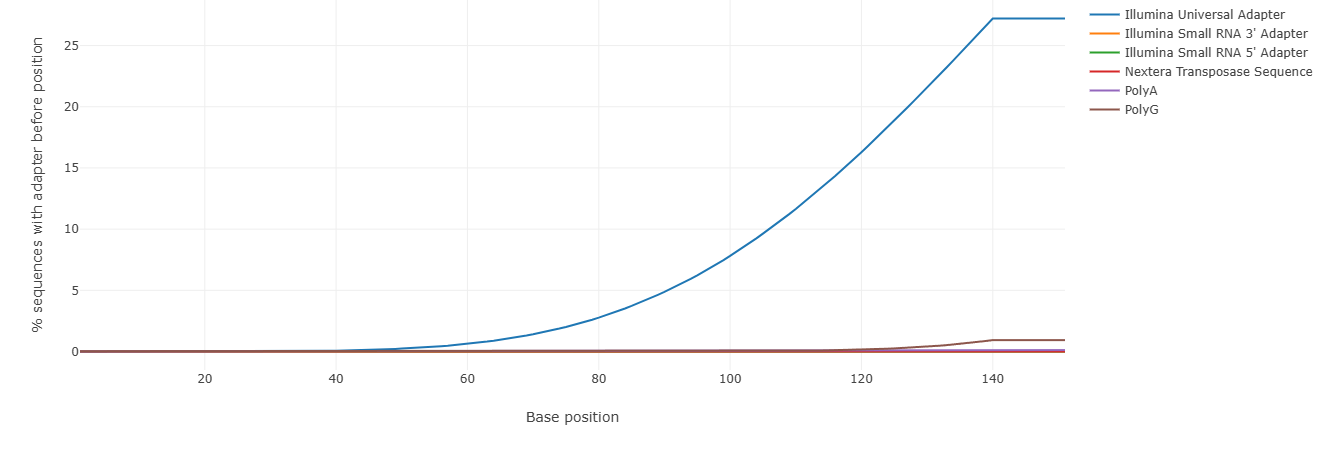
Adapter content (Falco)
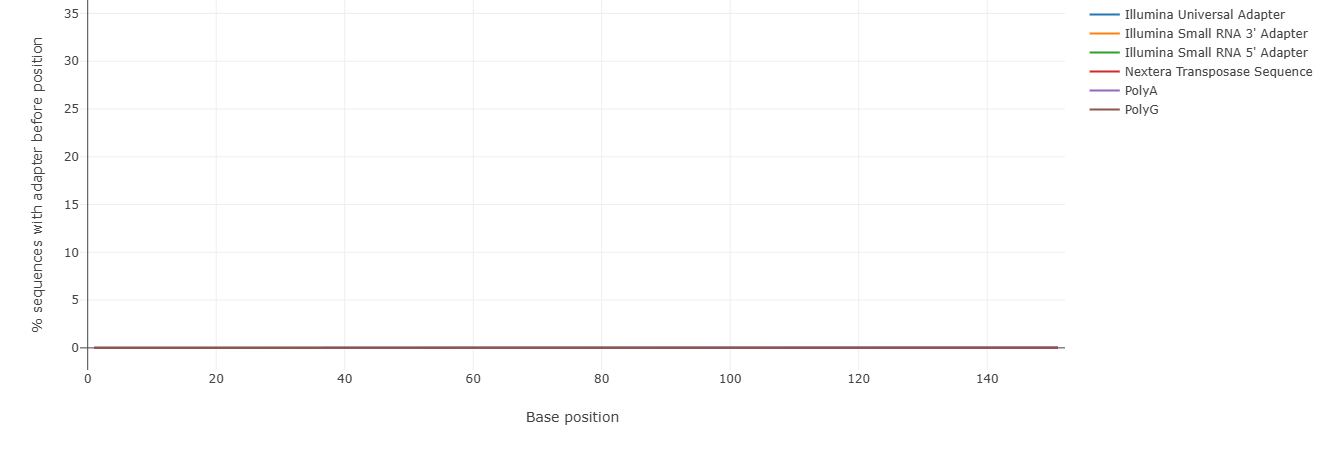
We recall that Illumina sequencing uses adapters that are ligated to the DNA fragments. They serve as primer binding sites and for binding the fragments to the FlowCell. They are, of course, contaminants and are not desired in the subsequent analysis of the sequence data.
Contamination of the sequence data with adapters is also shown in the falco tool. The Illumina adapters used for sequencing are correctly recognized in our dataset:
Quality and adapter trimming
A very important step in read processing is to filter the reads according to quality and adapters. This is usually/always done after receiving the raw sequencing data and before further analyzing (e.g. genome assembly, metagenomic analysis) the data. So now we have to address two important points:
- How can we improve the quality of the sequencing retrospectively?
- How do we get rid of the adapters from each read?
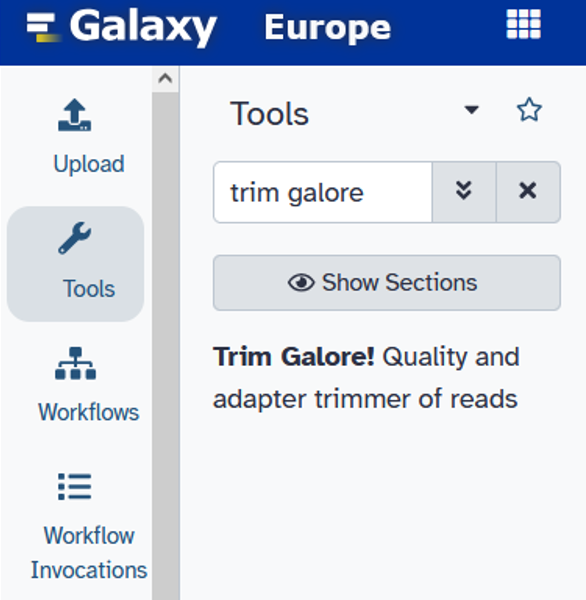
Of course, there are a number of tools available for filtering reads, e.g. trimmomatic or Trim Galore!.
In this course, I will continue working with the tool Trim Galore!.
To filter the quality and remove the adapters, we use the tool Trim Galore!. By now, you should be familiar with selecting tools in Galaxy. You should also know how to select the parameters of the tools in the Centre Panel.
Can you start the tool Trim Galore!. with the following parameters?
- Chose
Trim Galore!from the tools panel. - Click on
Trim Galore! - Set the following parameters (leave everything else as default):
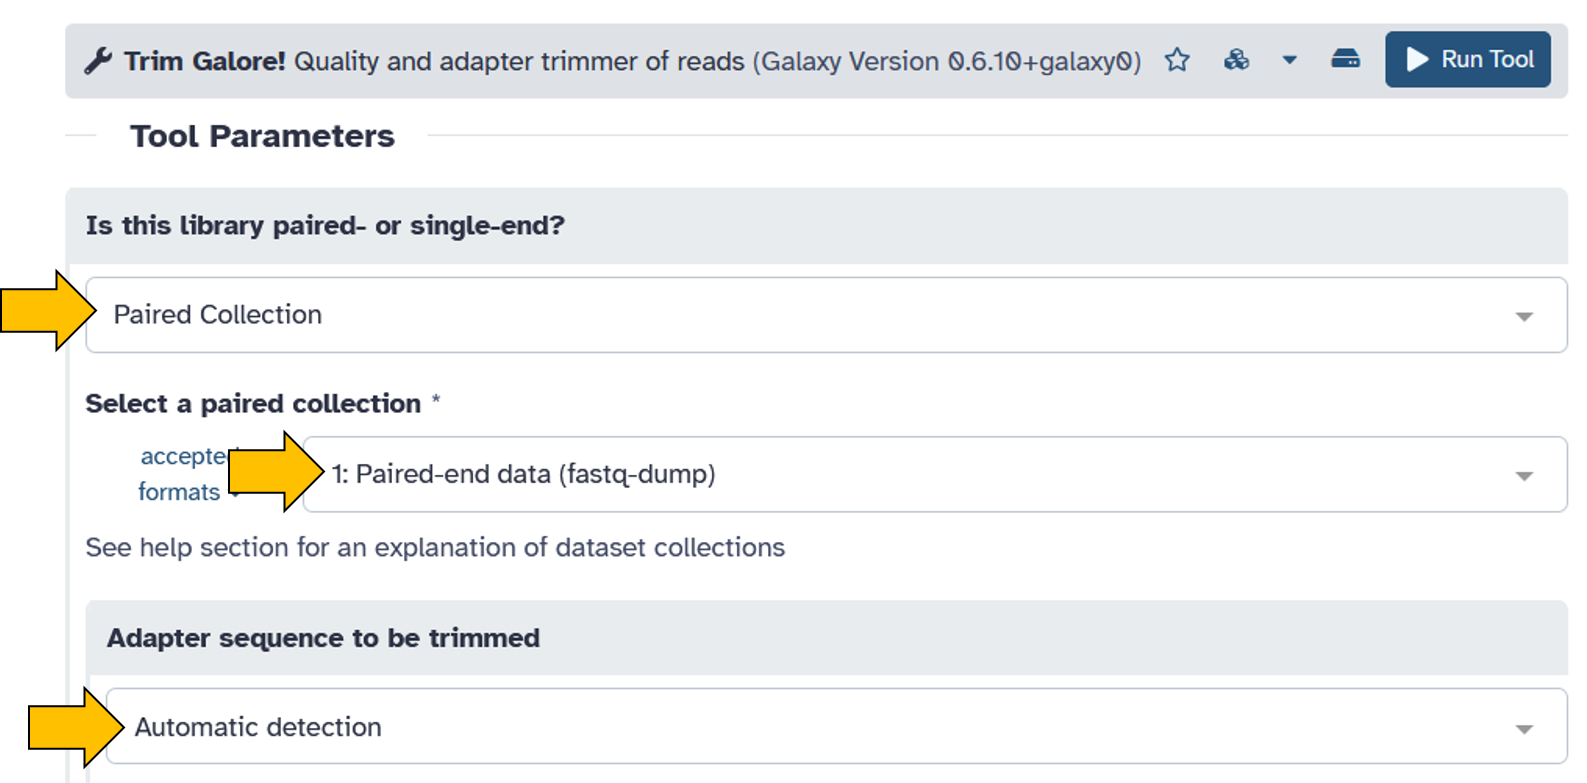
- Is this library paired- or single-end:
Paired Collection - Select a paired collection:
Paired-end data (fastq-dump) - Adapter sequence to be trimmed:
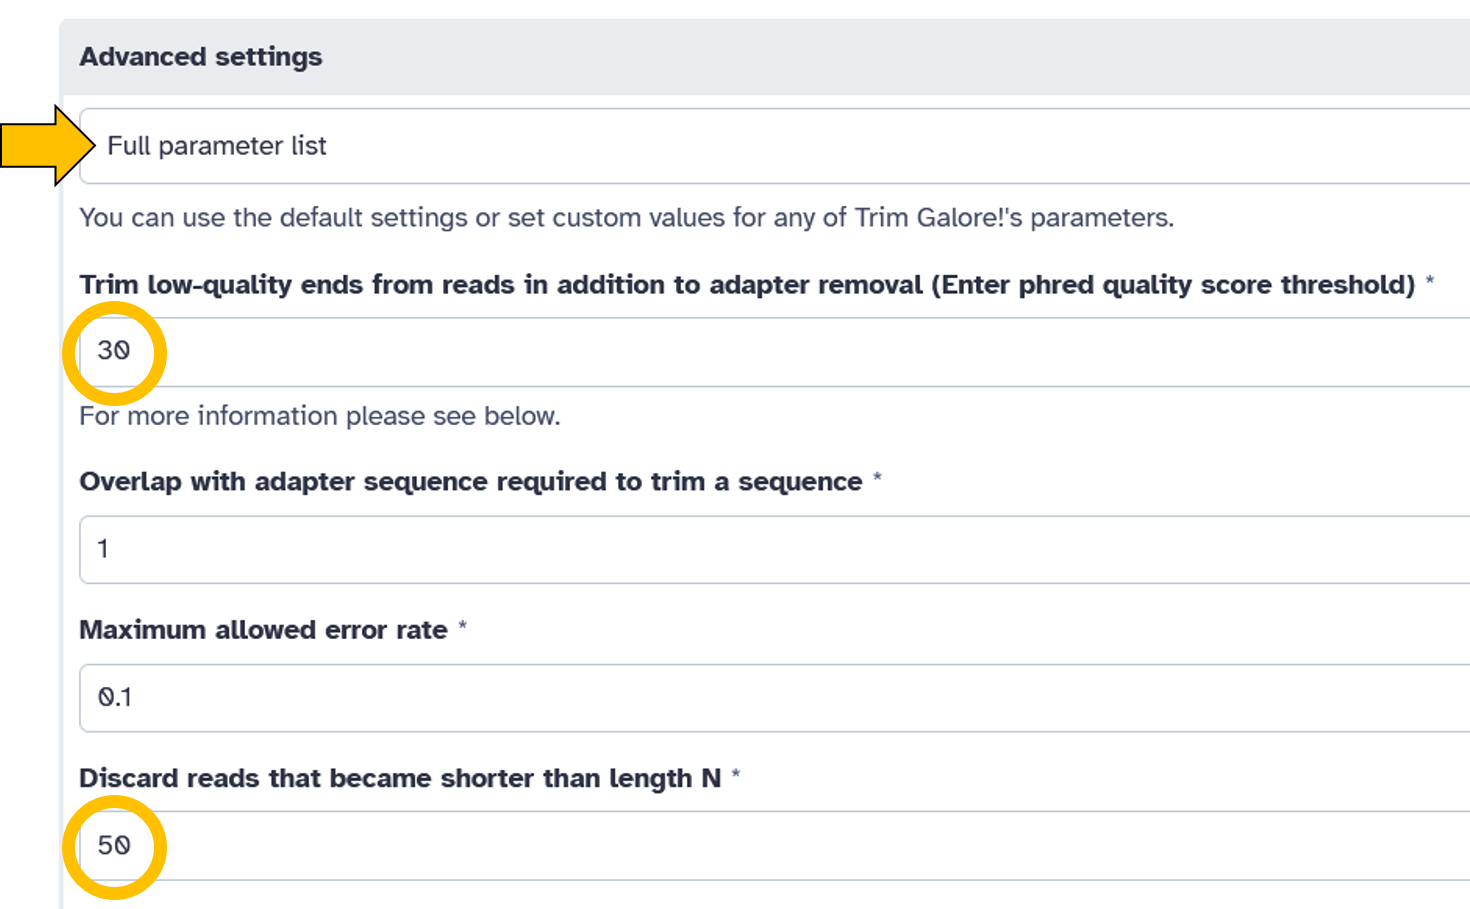
Automatic detection - Advanced settings =
Full parameter list:- Trim low-quality ends from reads in addition to adapter removal (Enter phred quality score thresold):
30 - Discard reads that became shorter than length N:
50
- Trim low-quality ends from reads in addition to adapter removal (Enter phred quality score thresold):
- Is this library paired- or single-end:
- Click on
Run Toolto filter your Illumina paired-end dataset.
Set the Trim Galore! options as follows:
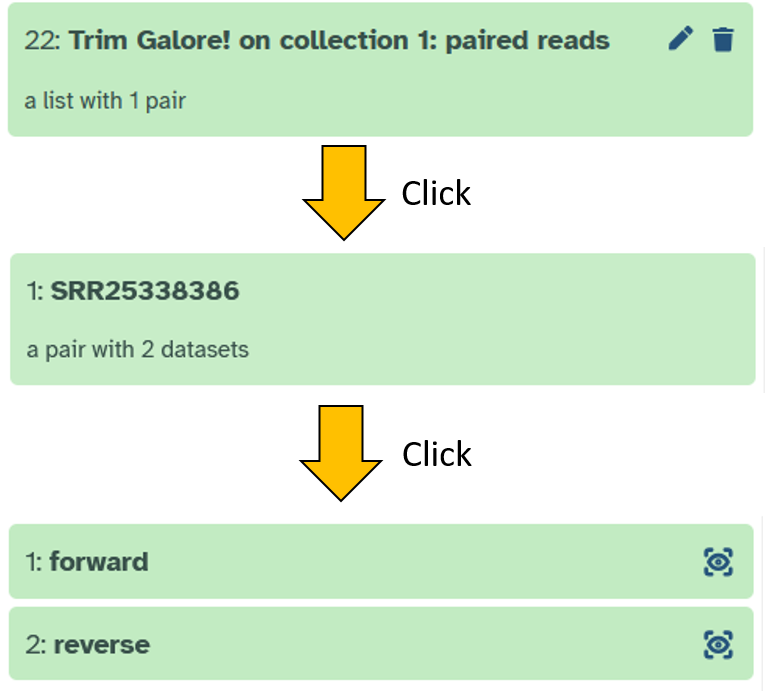
After clicking on Run Tool to start Trim Galore!, the result should look like this after a short while (click through the collection to see the structure):
Checking the quality filter/adapter removel step
How can we see whether quality filtering and removing the adapters has worked? We need to make sure that our parameters have been set correctly and that the tool has worked properly.
Fortunately, there is a simple solution for this: we start the falco tool again, only this time the input is Trim Galore! on collectoin 1: paired reads.
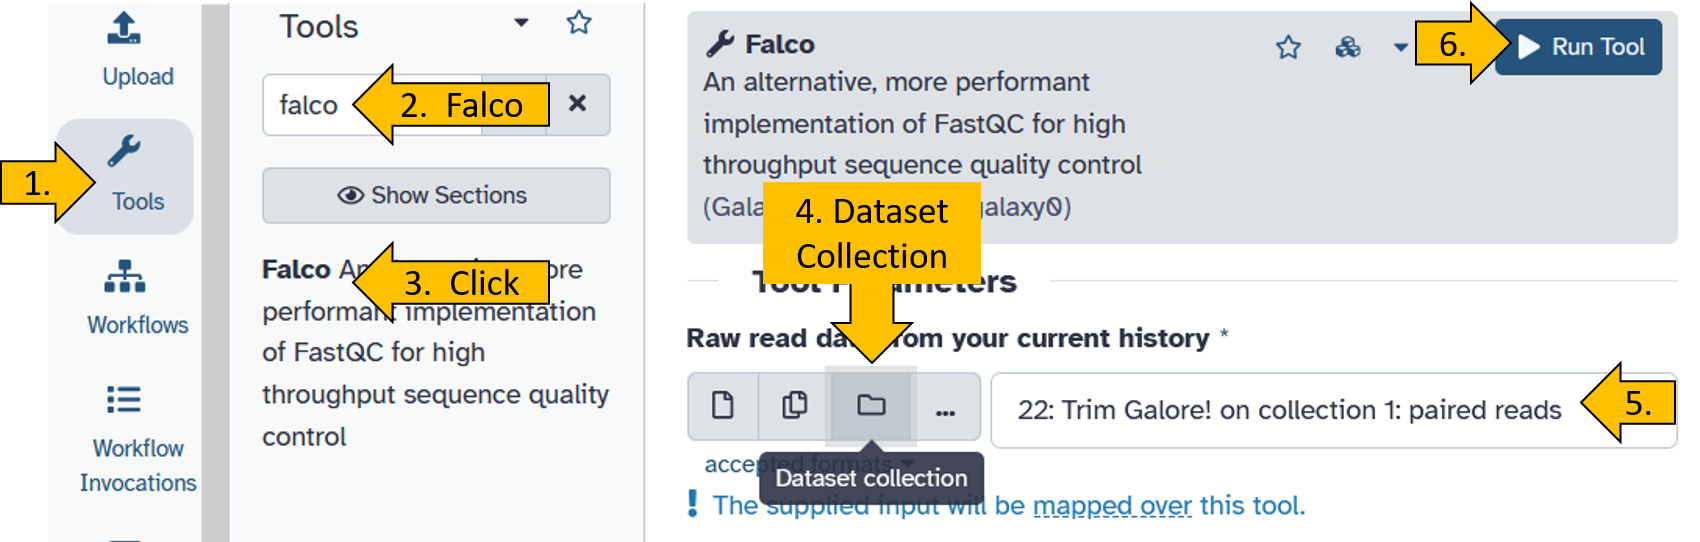
- Chose
Falcofrom the tools panel. - Click on
Falco - Set the following parameters (leave everything else as default):
- Raw read data from your current history –> switch to Dataset Collection as input
- Raw read data from your current history:
Trim Galore! on collection x: paired reads(x = it can be any number depending on the file position in your history)
- Click on
Run Toolto filter your Illumina paired-end dataset.
Set the Trim Galore! options as follows:
Wait until the tool has finished running and open the result.
Do you remember how to open up the result?
- Click on
Falco on collection xx: Webpage - Click on
SRR25338386 - Click on
forwardonce to open it up. - Click on the disk symbol to download the result:
- Save the ZIP file on your computer.
- Unzip the file.
- Open the Html document to see the results.
The output should look like the example below.
- Did the length of the Illumina reads change?
- Did the quality (Q) change?
Comparison before and after filtering
You have now looked at the Illumina Reads before and after filtering (quality and adapter). Think about what has changed. Can you describe it in your own words?
Have other parameters changed? Compare falco HTML document from the original and filtered reads!
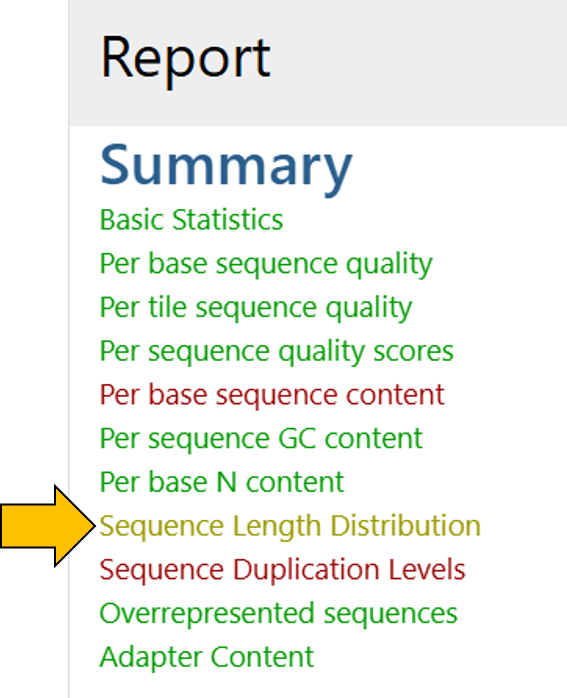
Check both hmtl files and compare the Sequence length distribution of the original and filtered reads.
Can you guess what has changed and why?