Sequence data format (fastq)
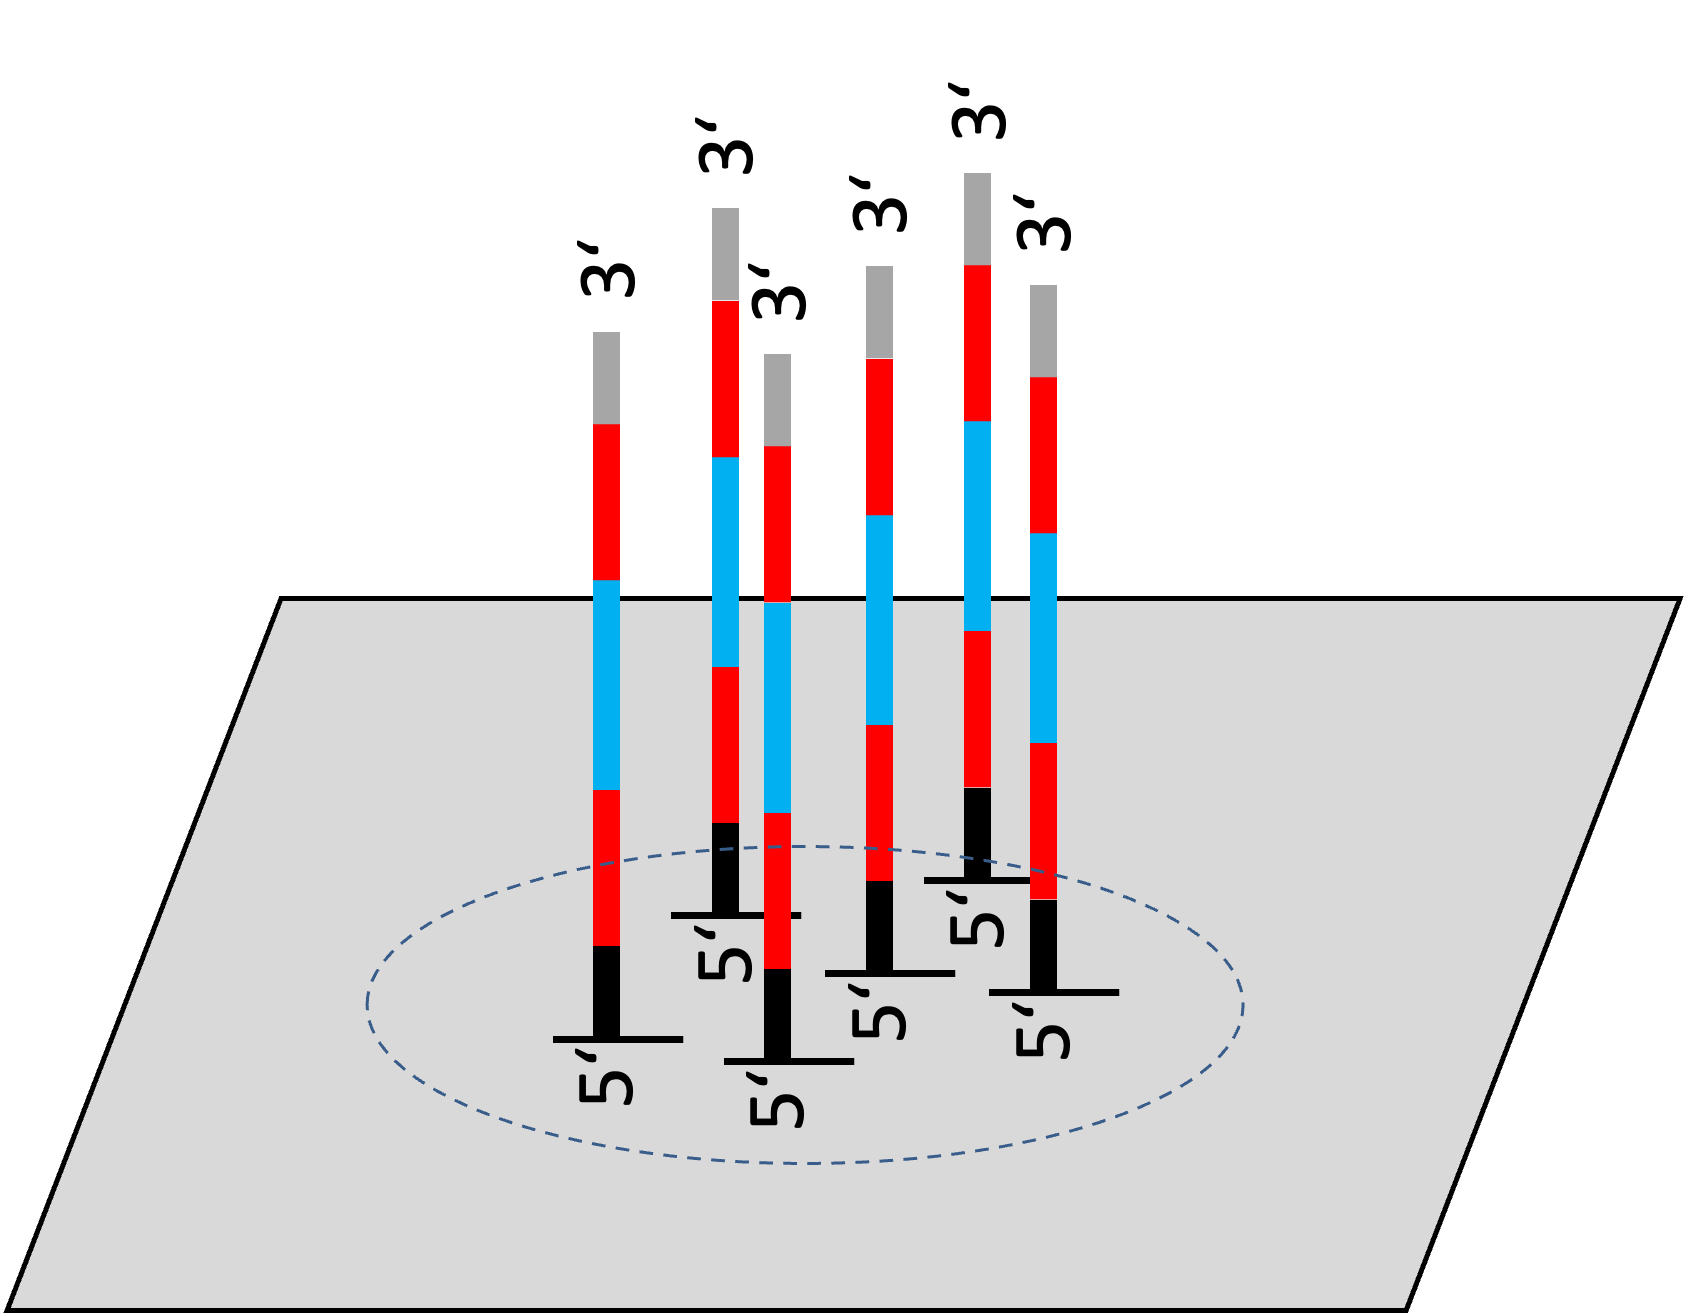
Illumina sequencing:
- Millions of sequences (= reads) are generated
- single-read sequencing = one file (R1)
- paired-read sequencing = two files (R1/R2)
MinION:
- reads are not paired!
- But saved in the same way!
Identifier (run, cluster, …)
Sequence (A, T, G, C)
“+” separator
Quality (ASCII)
For row format (fastq)
| Row | Description |
|---|---|
| 1st row | Identifier (run, cluster, location on flow cell, read number, etc.) |
| 2nd row | Nucleotide sequence (A, T, G, C, N) |
| 3rd row | Separator line (optionally repeats carries an identifier) |
| 4th row | Quality scores for each base (ASCII-encoded Phred scores) |
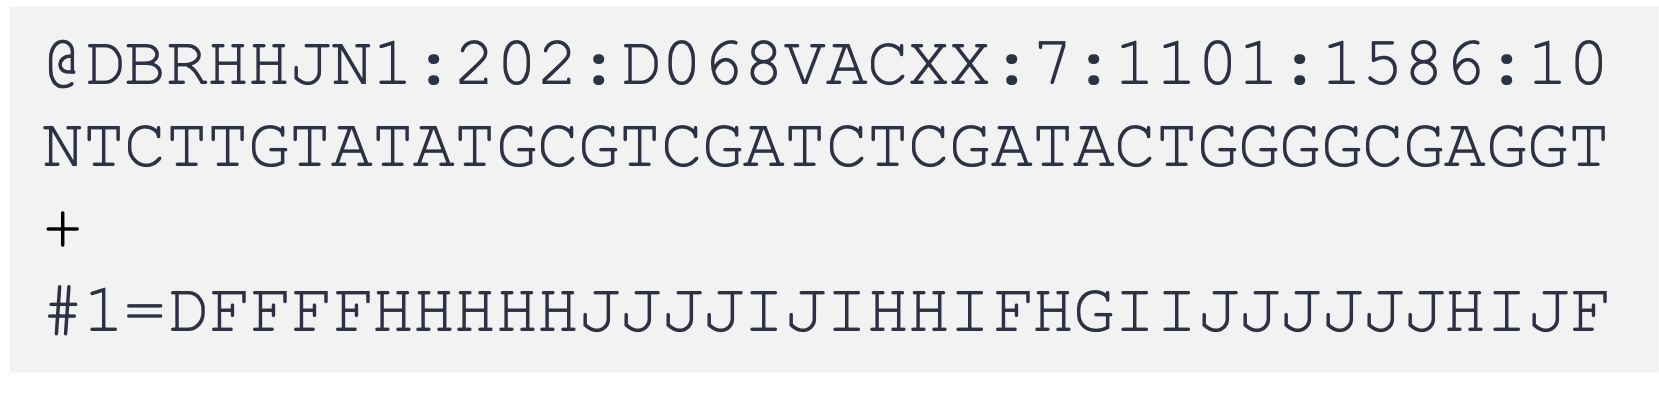
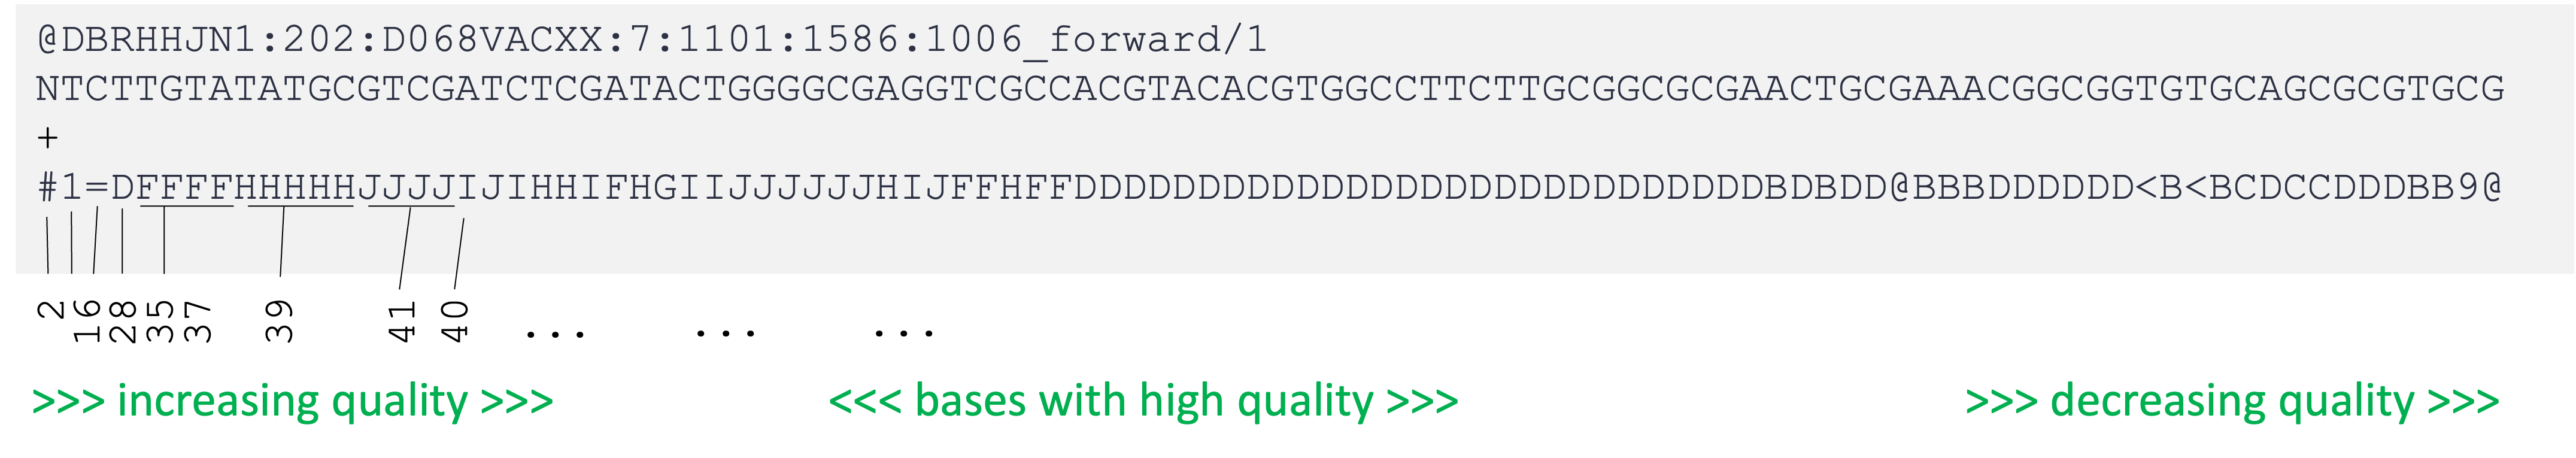
Read format
Example: NCBI SRA GenBank entry: SRR5560266 (single read data)
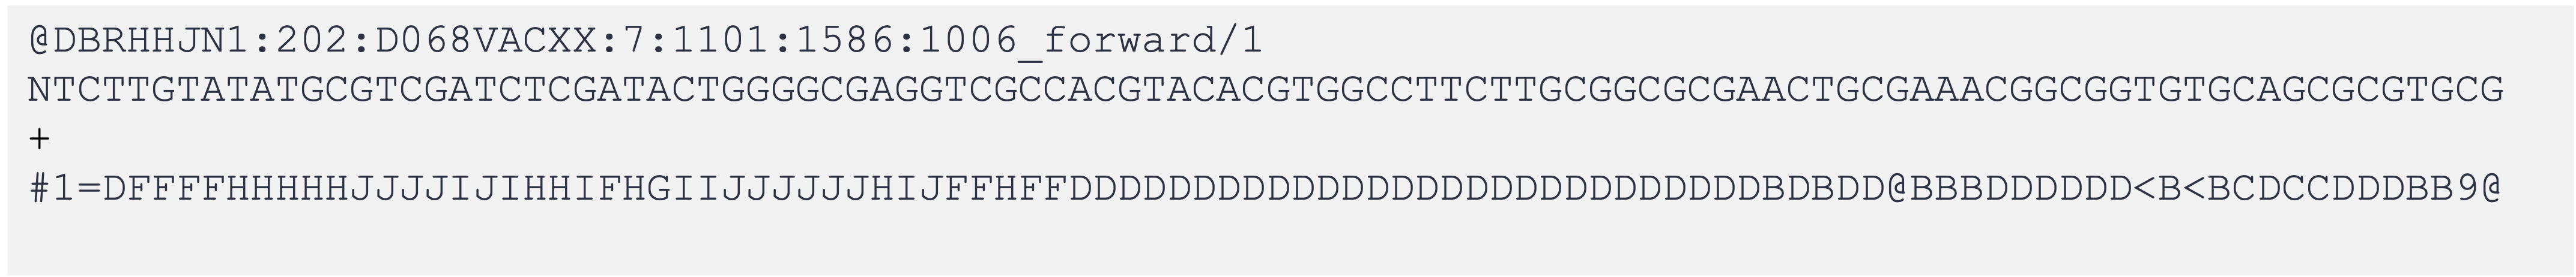
- The first row provides information about the cluster, read position, location, run, … https://help.basespace.illumina.com/articles/descriptive/fastq-files/
- Nucleotide sequence
- Spacer
- Base call quality for each nucleotide
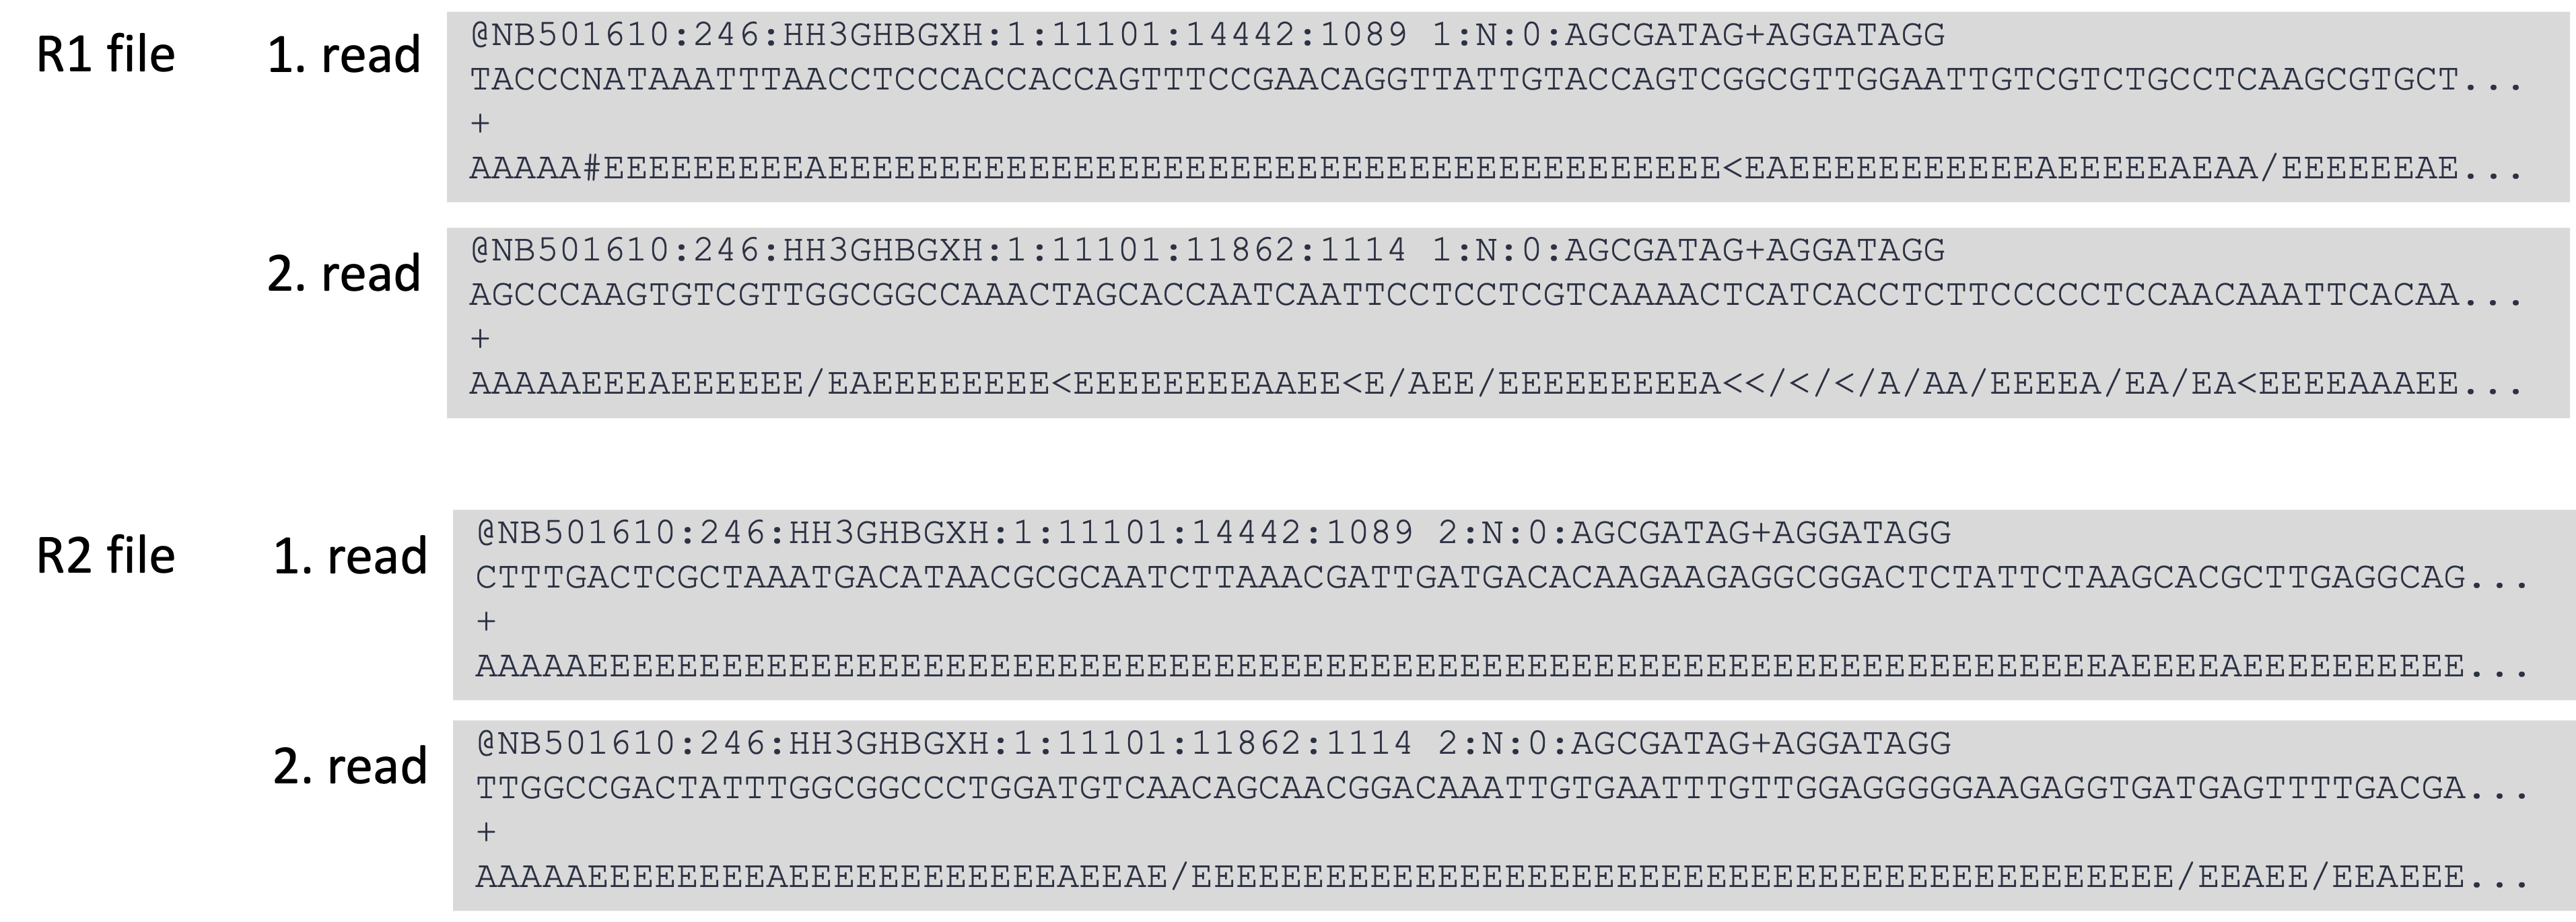
Read format (paired reads)
- Paired reads are saved in the same format as single read data
- Usually paired reads are stored in two separate files, each file with the same number and order of reads
- Paired reads have (almost) the same identifier
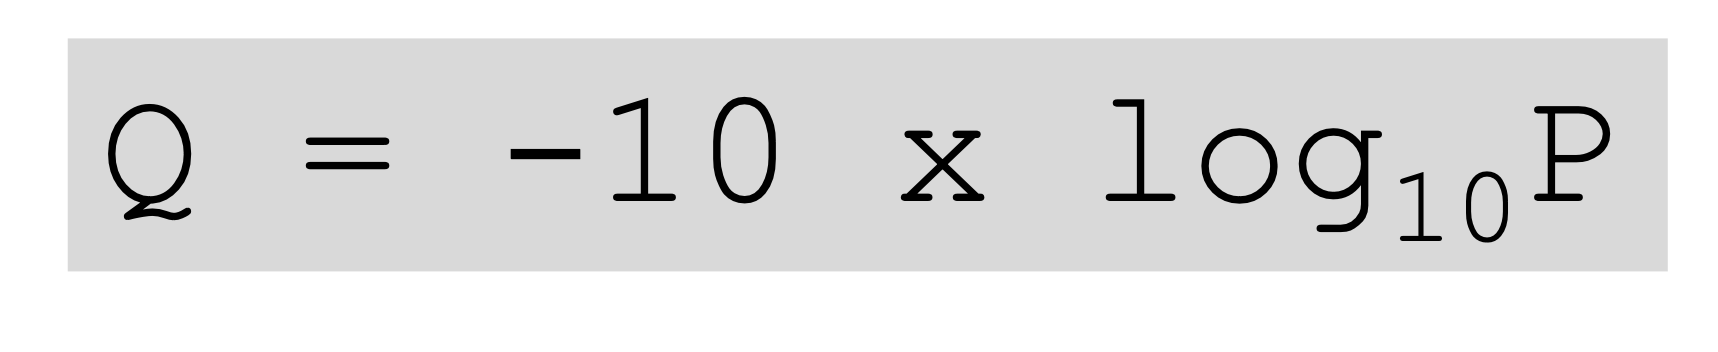
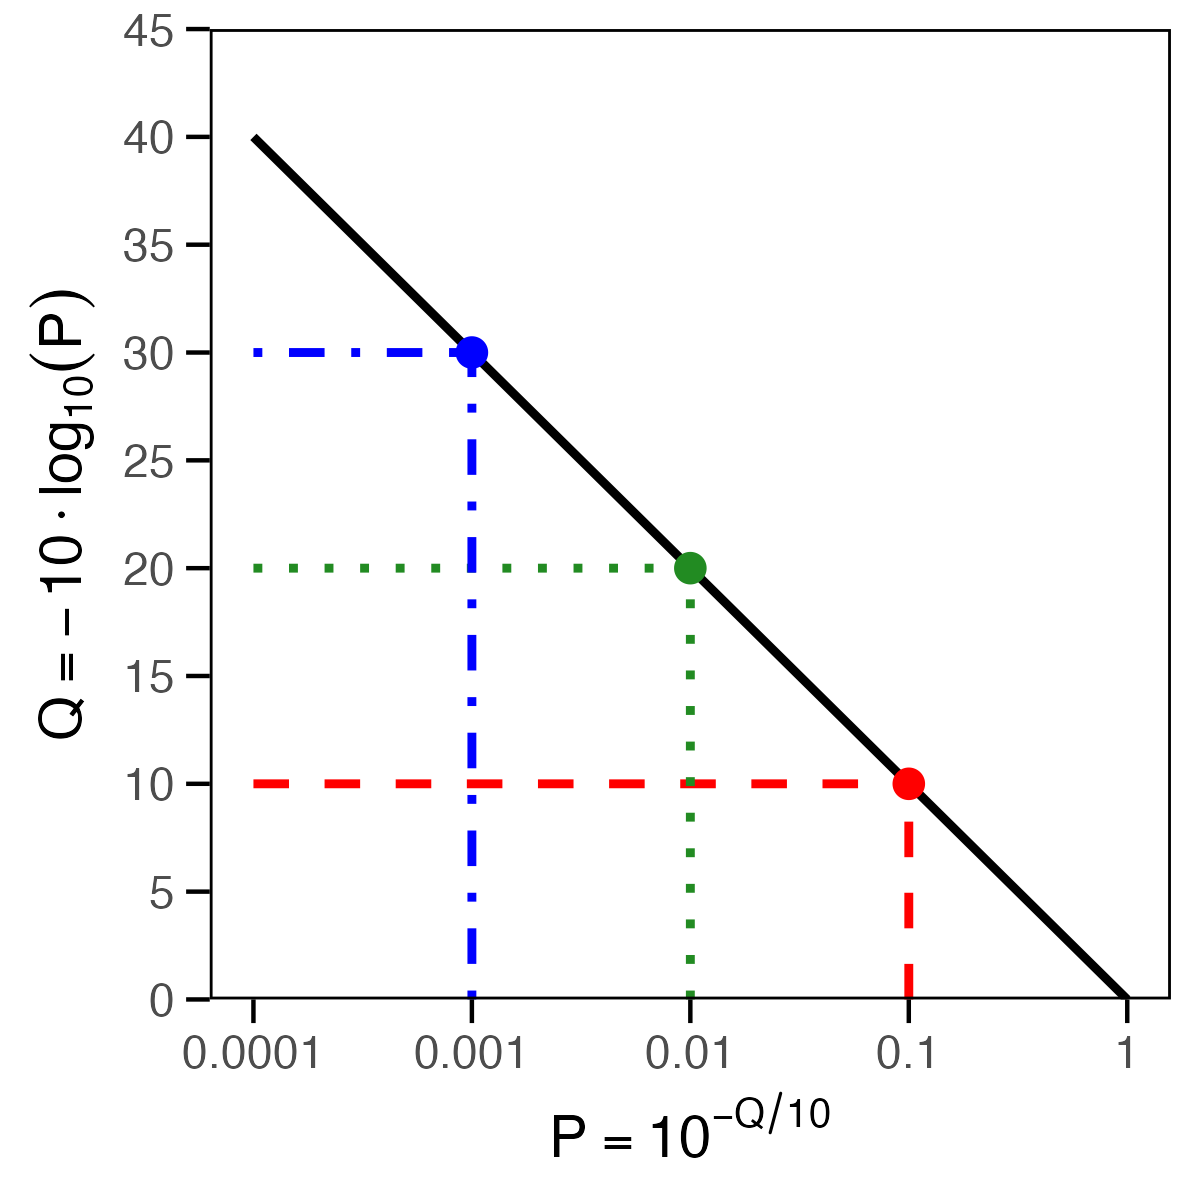
Read quality (Q) and error probability (P)
- quality = probability that a base is detected falsely
- each base gets its own quality score = Q score
- Q = Phred quality score
- P = base-calling error probability
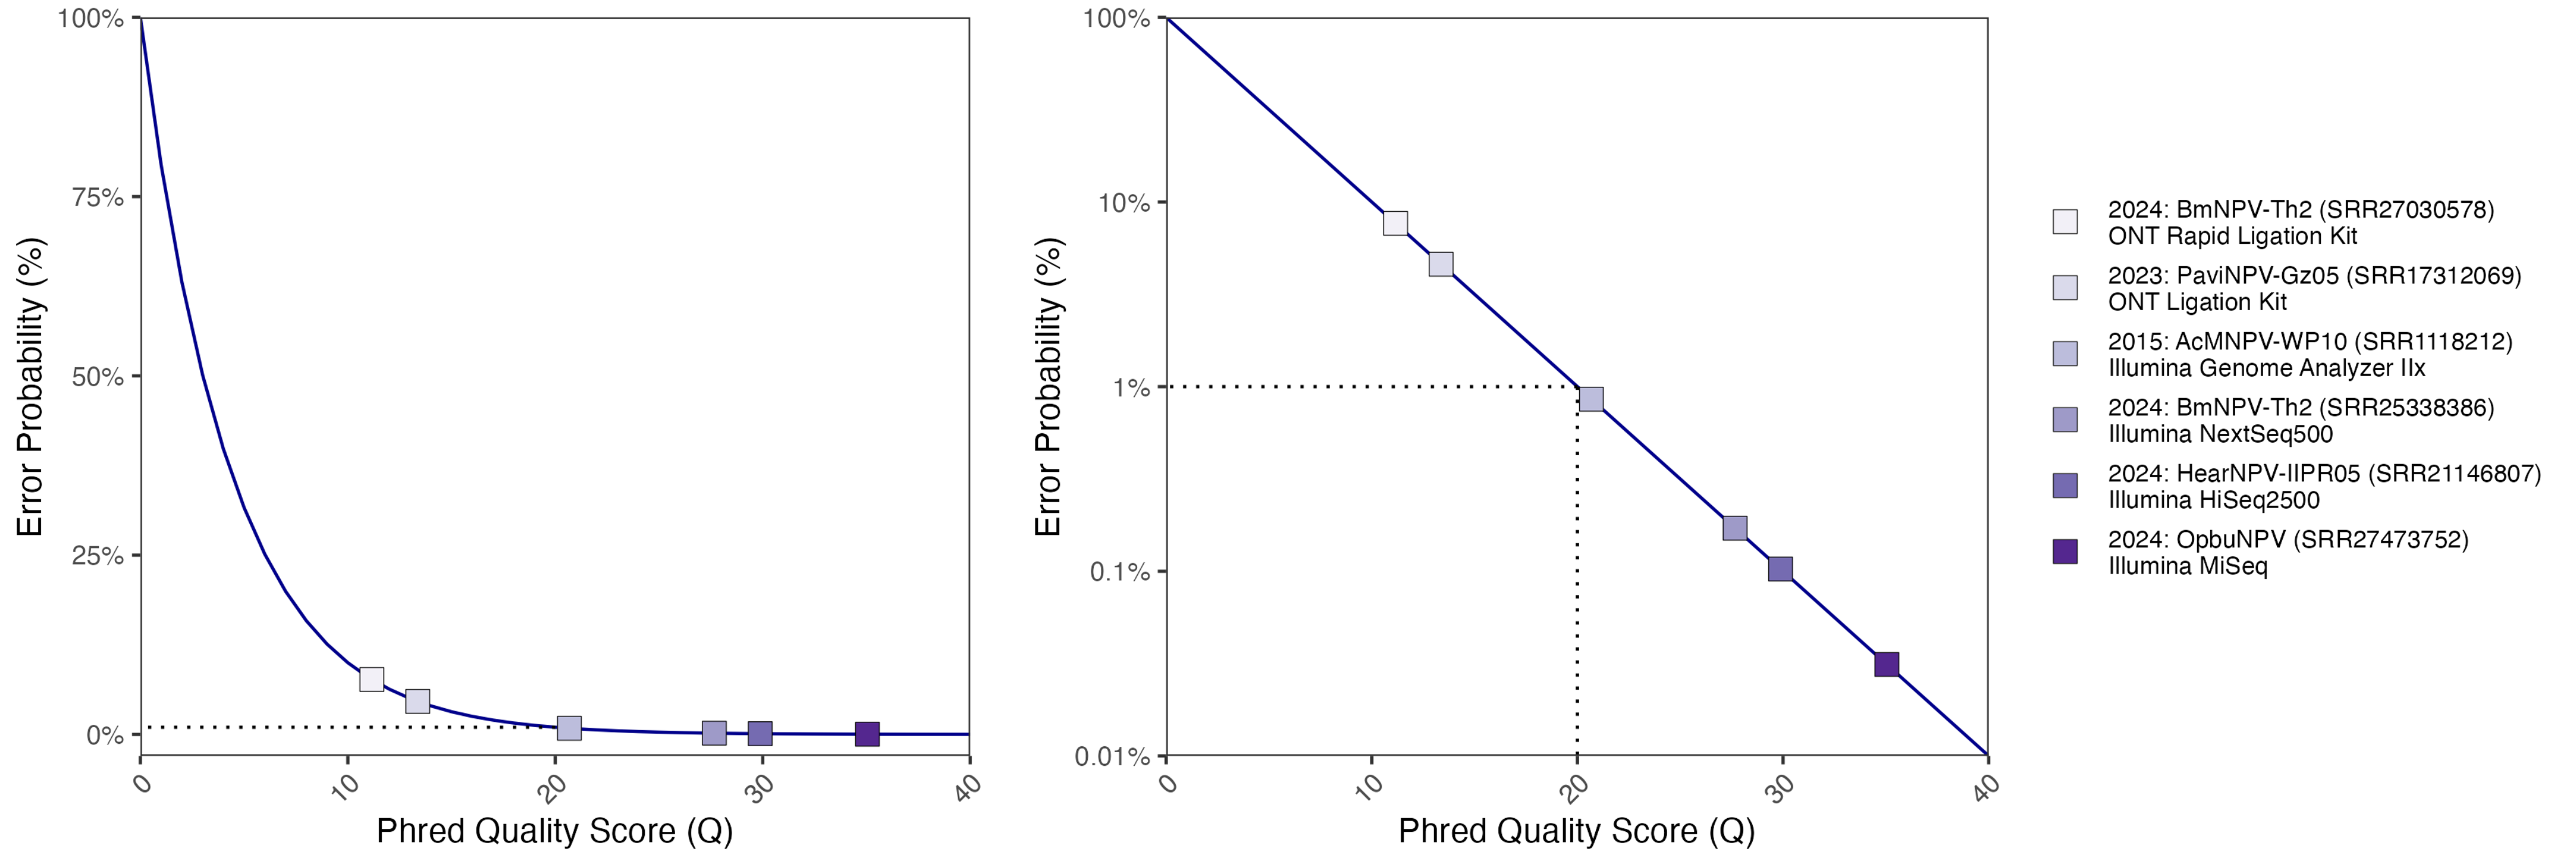
Read quality: Illumina vs Nanopore data
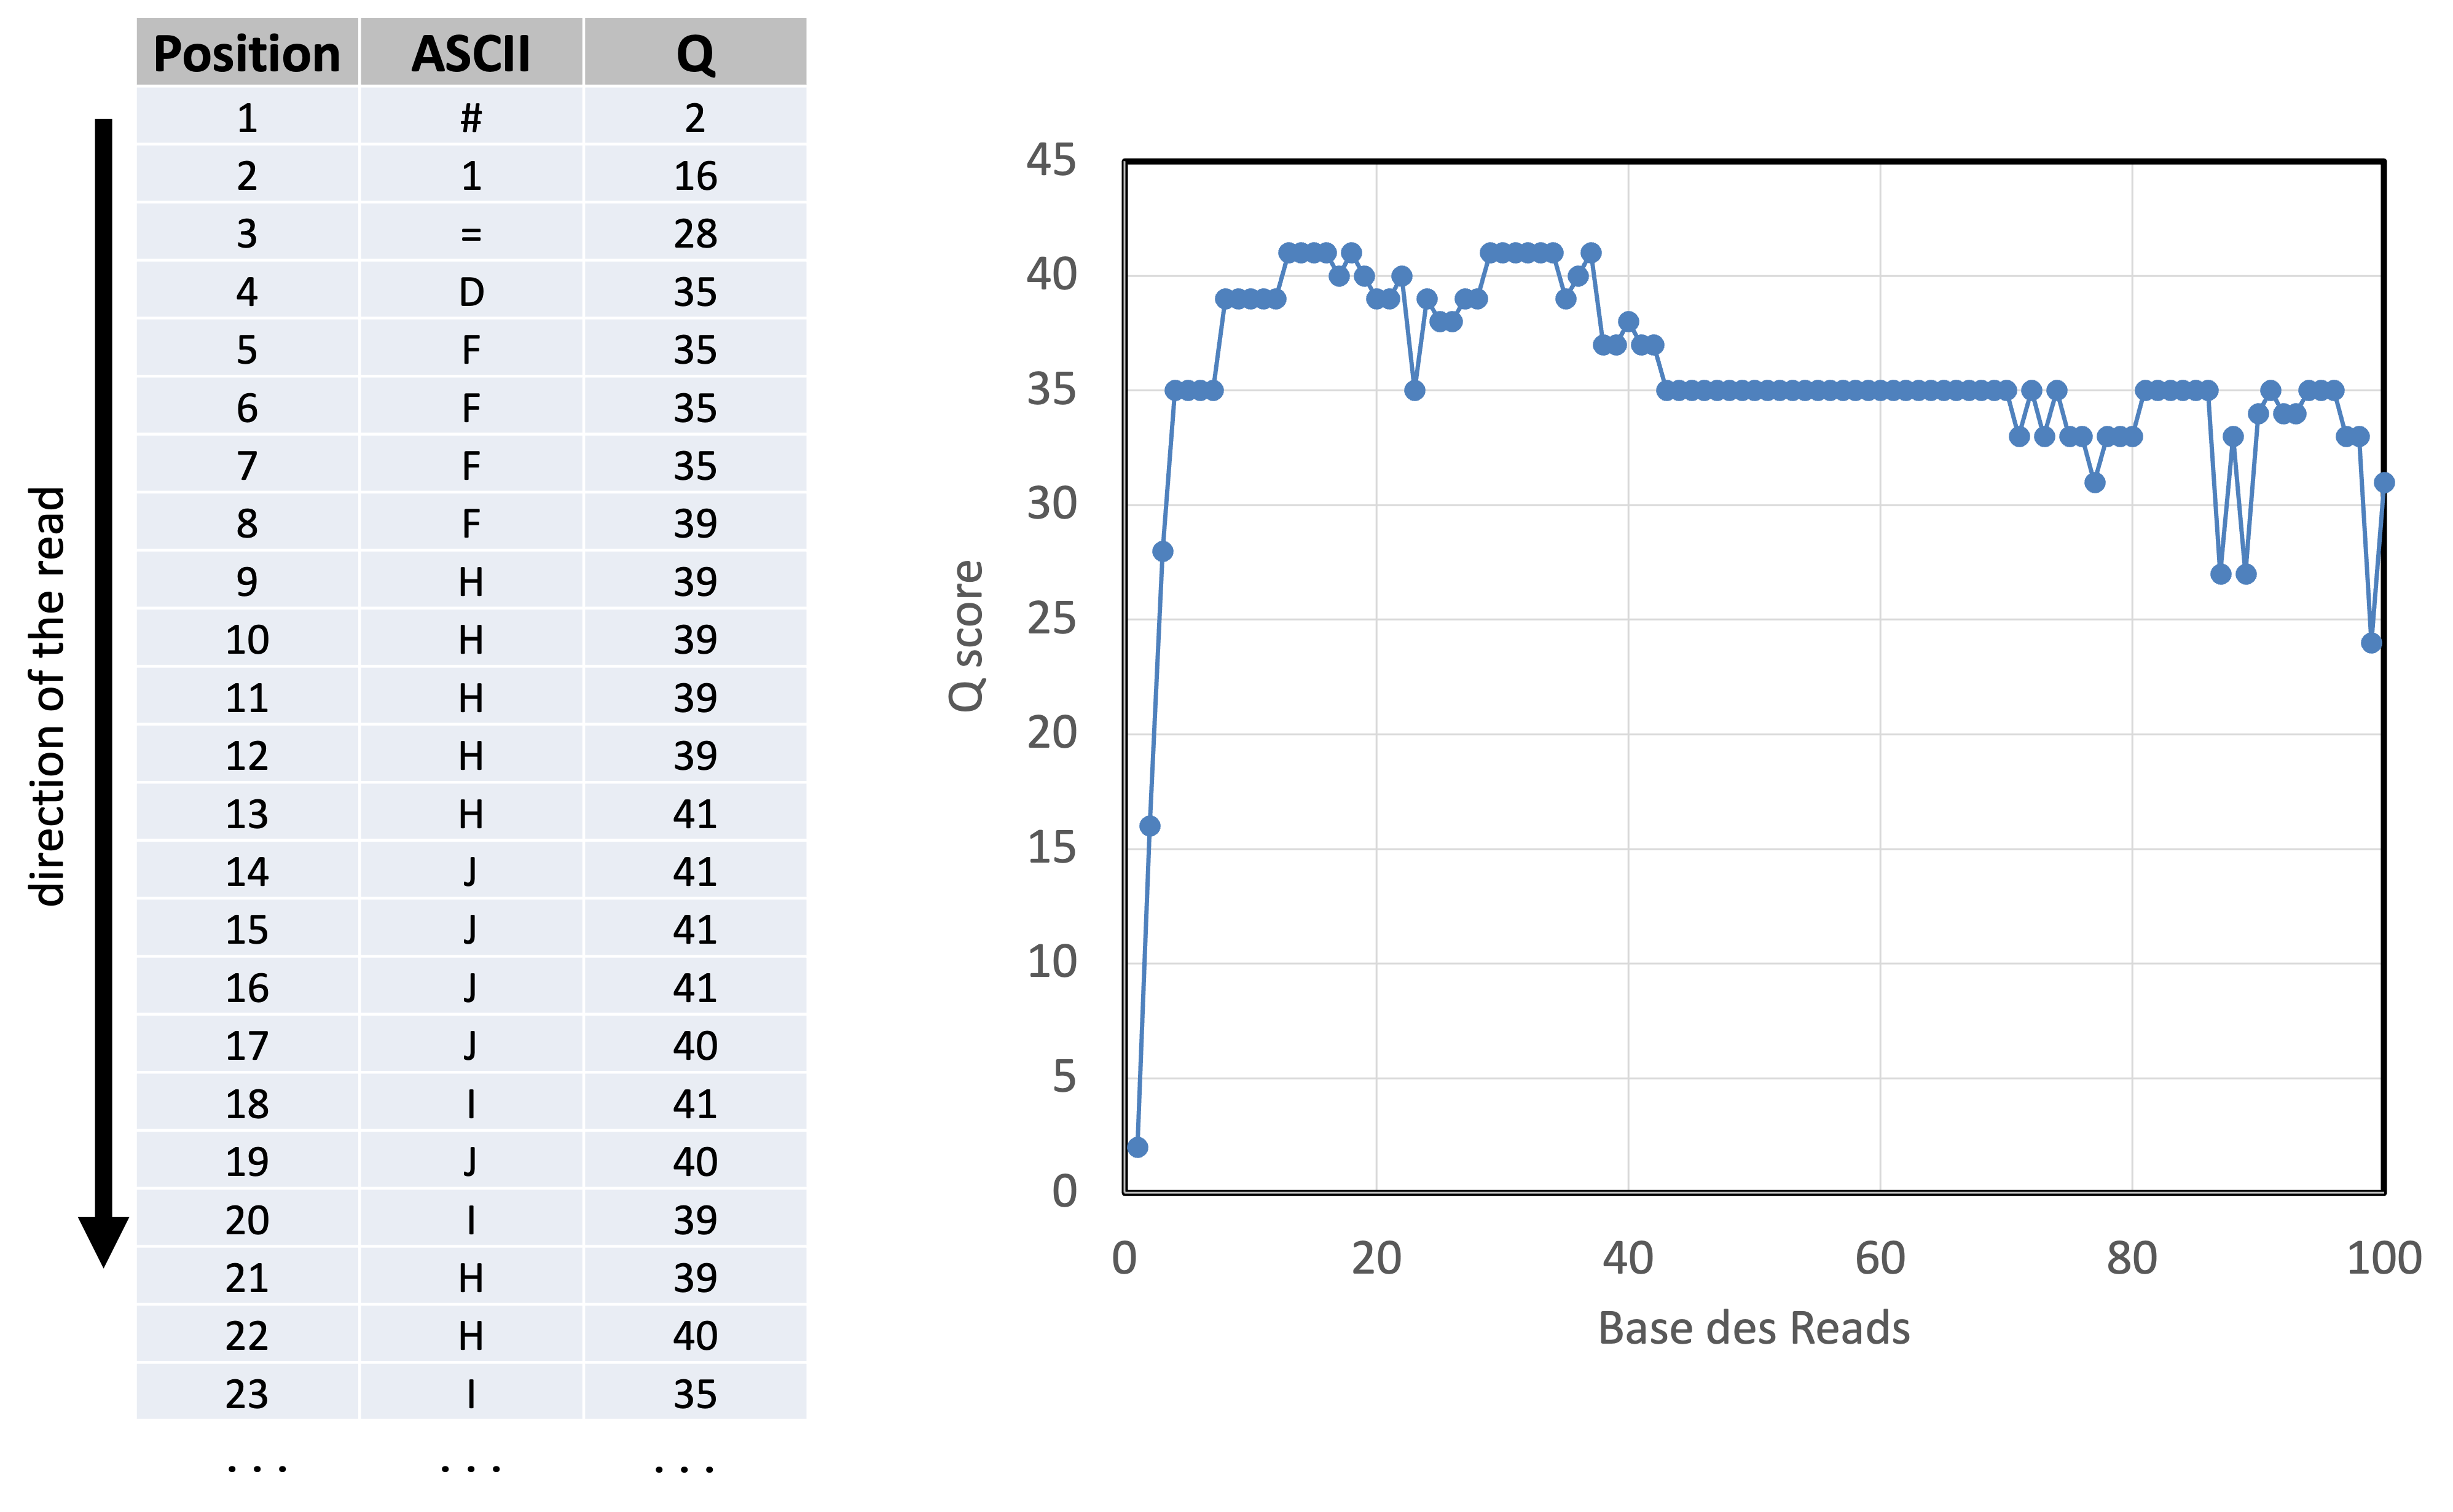
Read quality (Q) is encoded in ASCII format
| Q | P_error | ASCII | Q | P_error | ASCII | Q | P_error | ASCII | Q | P_error | ASCII |
|---|---|---|---|---|---|---|---|---|---|---|---|
| 0 | 1.00000 | ! | 11 | 0.07943 | , | 22 | 0.00631 | 7 | 33 | 0.00050 | B |
| 1 | 0.79433 | ” | 12 | 0.06310 | - | 23 | 0.00501 | 8 | 34 | 0.00040 | C |
| 2 | 0.63096 | # | 13 | 0.05012 | . | 24 | 0.00398 | 9 | 35 | 0.00032 | D |
| 3 | 0.50119 | $ | 14 | 0.03981 | / | 25 | 0.00316 | : | 36 | 0.00025 | E |
| 4 | 0.39811 | % | 15 | 0.03162 | 0 | 26 | 0.00251 | ; | 37 | 0.00020 | F |
| 5 | 0.31623 | & | 16 | 0.02512 | 1 | 27 | 0.00200 | < | 38 | 0.00016 | G |
| 6 | 0.25119 | ’ | 17 | 0.01995 | 2 | 28 | 0.00158 | = | 39 | 0.00013 | H |
| 7 | 0.19953 | ( | 18 | 0.01585 | 3 | 29 | 0.00126 | > | 40 | 0.00010 | I |
| 8 | 0.15849 | ) | 19 | 0.01259 | 4 | 30 | 0.00100 | ? | 41 | 0.00008 | J |
| 9 | 0.12589 | * | 20 | 0.01000 | 5 | 31 | 0.00079 | @ | 42 | 0.00006 | K |
| 10 | 0.10000 | + | 21 | 0.00794 | 6 | 32 | 0.00063 | A |
Read quality (Q) is encoded in ASCII format
| Q | P_error | ASCII | Q | P_error | ASCII | Q | P_error | ASCII | Q | P_error | ASCII |
|---|---|---|---|---|---|---|---|---|---|---|---|
| 0 | 1.00000 | ! | 11 | 0.07943 | , | 22 | 0.00631 | 7 | 33 | 0.00050 | B |
| 1 | 0.79433 | ” | 12 | 0.06310 | - | 23 | 0.00501 | 8 | 34 | 0.00040 | C |
| 2 | 0.63096 | # | 13 | 0.05012 | . | 24 | 0.00398 | 9 | 35 | 0.00032 | D |
| 3 | 0.50119 | $ | 14 | 0.03981 | / | 25 | 0.00316 | : | 36 | 0.00025 | E |
| 4 | 0.39811 | % | 15 | 0.03162 | 0 | 26 | 0.00251 | ; | 37 | 0.00020 | F |
| 5 | 0.31623 | & | 16 | 0.02512 | 1 | 27 | 0.00200 | < | 38 | 0.00016 | G |
| 6 | 0.25119 | ’ | 17 | 0.01995 | 2 | 28 | 0.00158 | = | 39 | 0.00013 | H |
| 7 | 0.19953 | ( | 18 | 0.01585 | 3 | 29 | 0.00126 | > | 40 | 0.00010 | I |
| 8 | 0.15849 | ) | 19 | 0.01259 | 4 | 30 | 0.00100 | ? | 41 | 0.00008 | J |
| 9 | 0.12589 | * | 20 | 0.01000 | 5 | 31 | 0.00079 | @ | 42 | 0.00006 | K |
FASTQ encoding: ASCI <-> Q score <-> read quality
Take-home message
- Reads are stored in FASTQ format
- One read has four lines
- Identifier
- Nucleotide sequence
- Spacer
- Nucleotide quality
- Q score = measure of base call accuracy
- Q is stored as ASCII characters (Phred+33)
- Higher Q –> lower error probability
- Quality profiles help to detect sequencing problems